
How to Perform ASTM Capacity Testing - Step-by-Step
Steps in the Capacity Testing Process - New Solar Farm Construction
The Art and Science of Validating Performance and Avoiding Contractual Risk
1. Introduction to Regression-Based Capacity Testing Standards
Capacity testing is one of the most important steps in verifying the performance of a solar project before final handoff. It ensures the system operates as expected and meets contractual performance guarantees. Two key tools in this process are ASTM E2939 and ASTM E2848—standards that work together to define expected performance and then measure actual results.
In this guide, we’ll walk through the correct process for applying each standard, examine how EPC contracts structure capacity testing, and highlight best practices to ensure reliable, fair, and transparent results.
2. ASTM E2939 vs. ASTM E2848: Setting Expectations vs. Measuring Reality
These two standards serve complementary roles in performance verification:
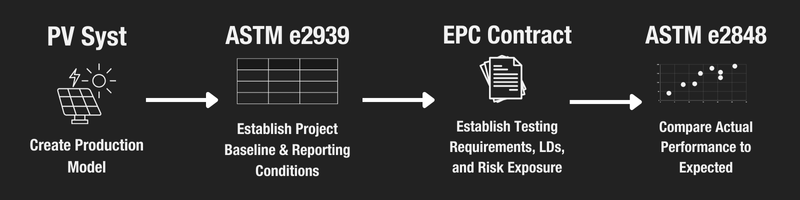
• ASTM E2939 is used before testing to establish expected project performance under typical weather conditions at the site. Using historical solar resource data and energy modeling (e.g., PVsyst), E2939 defines the “reporting conditions” and expected power output across a matrix of irradiance and temperature bins. This regression model becomes the performance benchmark.
• ASTM E2848 is then used during testing to analyze real-time monitored data and determine the actual capacity of the system. It integrates POA irradiance, temperature, and AC output over time and normalizes that data to the reference conditions defined by the E2939 model.
In short: E2939 sets the expectations, and E2848 tells you how the system actually performs in the field.
3) Technical Foundations - Irradiance + Temperature = Destiny!
The basic idea of the ASTM capacity testing is that, within certain constrained bounds, measuring solar plant capacity should be a simple equation.
Irradiance theoretically increases power at a predictable rate.
Module temperature decreases power at a predictable rate.
So if you know irradiance and temperature, you should be able to predict output! If the output differs from predicted, the site’s broken!
If only it were as simple as this model.
Realities in the Field: Why the Simple Performance Model Doesn’t Work
In practice there are complications to simple model.
First, module temperature is not possible to capture adequately with standard monitoring systems.
The relevant data types that you ACTUALLY have to work with are site ambient temperature and site wind speed, which are captured by standard met stations. These impact module temperature in a complex manner that depends on irradiance as well.
Secondly, except in rare cases, you don’t have access to DC module level production. You only have access to on-site revenue grade meter(s) are typically located very far downstream. This means the measured output is exposed to all of the complications of real world design of the electrical system - voltage drop, combiner efficiency, inverter efficiency, and in some cases, transformer efficiencies (depending on if the metering is done on low or high voltage side of the transformer).
Thirdly, inverter clipping means that during periods of high irradiance, that a major confounding variable that quickly erases the connection between more sunshine in and more power out.
Fourth, low irradiance creates some stochasticity with inverters, which in practice respond to activation voltages and currents, parasitic loads etc.
Fifth, unstable irradiance (passing or scattered clouds) is hard to capture adequately (there are insufficient data points from 1-few met stations, and insufficient data precision in 1-5 minute interval data).
All of this means that the real world is a lot messier than the “Irr&Temp In, Watts Out” model would suggest. Irradiance has to be just right to model effectively - not too low, too high, or too variable. Power output expectations have to account for full system losses somehow. And you need an explicit or implicit model that triangulates module temperature from ambient temp, windspeed, and irradiance.
History of MW-Scale “Catch All” Testing
In the solar industries early days, it was possible to sweep most of these complications under the rug. This worked basically because of chance, contingent realities of the early industry.
1) Low DC/AC ratio in practice. There was MUCH less clipping in early industry designs. Modules were expensive, and inverters were fragile. 1.0-1.2 DC/AC ratios were common in utility solar projects. Now much higher ratios are the norm, and clipping often occurs 4 hours a day.
2) Irradiance was stable in practice. That’s because expensive-to-build projects only made sense to locate in places where irradiance was stable. In practice, testing occurred in cool, clear deserts, not today’s standard of “literally every nook and cranny that’s near a feeder with capacity.” So things were less complicated to model
In EPC contracts, a testing protocol from PVUSA was a pretty common “catch all” in place of the ASTM, but really only worked well in the proscribed conditions above. There have been attempts to create more univeral deterministic models, i.e. Sandia model, but they’re complicated (20+ empirical data types). And despite some early hopes around “IoT everywhere” monitoring a decade or so ago, it’s never been financially feasible to capture all of that data.
How the ASTM Methods Attempt to Cut Through the Data Noise.
The ASTM standards attempt to tackle the real world challenges with two parts.
1) First filter out all the “noisy data”
Ex: inverter clipping, low irradiance, known curtailment periods, etc.)
2) Run multivariable regressions to generate a better, site specific, predictive model
You can think of statistical regression as a way to cut through all of the remaining noise using math instead of logic. Instead of trying to generate a universal deterministic predictive model of how irradiance, temp, and windspeed interact to create power output, a regression creates a model inductively for a specific site. It takes lots of data, runs the math, and outputs the relative impact of these factors.
This then can be used as a predictive model.
The created model is thus inherently site specific, but much more accurate than a flawed but universal model
Ok, with all of that as background, let’s talk about how this works.
4. PV Syst, weather files and 8760
PVsyst and the 8760 Report
ASTM E2939 relies heavily on energy simulation tools like PVsyst, which use long-term weather data to generate an hourly (8760) profile of system performance. 8760 is the number of hours in a year. An 8760 report includes 1 row of production data and weather data for each hour of a given year. These outputs are then binned by irradiance and temperature to build a multi-variable regression model. This model defines:
• Expected Reporting Conditions: Realistic site-specific irradiance and temperature ranges.
• Expected Performance Values: What the system should produce under those conditions.
This regression model becomes the standard against which actual performance is measured during ASTM E2848 testing.
This means that the creation of a PV Syst is the first step in foundational to a successful capacity testing.
Which version of a PV Syst should you use for capacity testing? Creating a “Contract-Standard” PV Syst
The reality of a project is that PV Syst models tend to evolve along with engineering versions over time. As engineering plans become more detailed (moving from 10% to As Builts), the PV Syst will evolve as well.
In general, our advice for the PV Syst to be used for the e293d is that it should match the design requirements of the system, typically defined in the Scope of Work of an EPC contract, not the initial design itself, which will often be incomplete at the time of the EPC contract. The exception to this is when a design is “fully baked” at the time of handoff (developer has fully engineered the site, taking the “E” out of EPC entirely).
As an example of how this works in practice, let’s take DC voltage drop. In PV Syst, vDrop can be modeled based on the actual equipment utilized, conductor distances, etc. It can also be input directly, e.g. “1% vDrop average.” The latter is preferable, because the former is likely to change substantially for early stage designs.
When max average vDrop is defined in the EPC contract terms, (and it should be!), this is the value that should be utilized.
5. Performing ASTM E2939: Defining Expectations with Historical Data
Next is E2939. E2939 is not a test you perform in the field—it’s a method for defining project expectations using historical weather data and predictive modeling .
Steps to Apply ASTM E2939:
• Use historical TMY or satellite-based irradiance data to model site weather.
• Run detailed simulations in PVsyst or an equivalent tool to generate an 8760 hourly file.
• Bin the output data by:
• Plane-of-array irradiance
• Module temperature
Filter data appropriately to ensure “sweet spot” of irradiance not too low to be unstable or zero, not to high to cause inverter clipping, not too cloudy to cause stochastic reads
Optional but preferred -Establish a table of monthly reporting conditions based on the 60th percentile of irradiance for the filtered data by month. This creates a more realistic picture of the likely reporting conditions given the season in which testing will actually occur, avoiding use of “summer time” assumptions for a harsh January commissioning timeline.
• Perform a multi-variable regression to define the expected AC output across various weather conditions.
• Define this regression model as your baseline for future comparison.
This baseline is critical—it forms the “yardstick” for measuring whether the system meets its contractual capacity under actual field conditions.
6. Capacity Testing Provisions in EPC Contracts
EPC agreements often contain provisions that impact how testing is structured, interpreted, and enforced.
Baseline Reporting Conditions
Some EPCs include predefined “reporting conditions” that may either be informed by or in some cases override ASTM E2939’s regression approach. If those conditions are rigid—like assuming constant temperature or fixed irradiance—they may poorly reflect actual site conditions, introducing unnecessary risk and inaccuracy into the performance verification process.
Testing and Retesting Procedures - Avoiding “P Hacking.”
Contracts usually spell out how many test attempts are allowed, under what conditions a test can be considered invalid, and what happens if a test fails. Clarity here is essential to avoid disputes during commissioning.
Root Cause Analysis Process - Who’s at Fault for Capacity Shortfalls? Developer or EPC?
Many years ago, true “turnkey” EPC contracts were the norm in the solar industry. EPCs took a raw piece of land with an interconnection agreement and did all the engineering, procurement (including major procurement), and construction.
While turnkey agreements still exist, they’re increasingly rare. Developers typically take on at least some of the EPC scope in the form of major procurement (i.e. modules, inverters), and engineering (i.e. 50% electrical design at handoff).
Accordingly, the risk for capacity shortfalls has become more nuanced as well. A performance issue with owner-supplied modules, for instance, could cause a capacity shortfall.
EPCs often refuse to take on liability for shortcoming of equipment they didn’t provide. This means that capacity test “failures” must also often specific a process for root cause analysis. If capacity is lower than expected, determining if the issue is with owner supplied equipment or engineering must be part of the process before blame can be assigned.
Liquidated Damages Clauses
Performance shortfalls often trigger financial penalties. If test results fall below contractually guaranteed values, liquidated damages can apply.
Formulas for performance and capacity LDs vary significantly, but significant capacity issues often entail liability in 6 and 7 figures for utility-scale projects. This underscores the importance of a fair and technically sound performance baseline—typically established through ASTM E2939 and a clear process for generating legitimate capacity results via ASTM e2848.
Required Testing Schedules
Testing may be constrained to specific windows—such as post-commissioning and pre-commercial operation date (COD). Delays in testing can delay project acceptance, final payments, or tax credit qualification.
Number of days allotted for testing, extra data points or minutes (above the minimum required by the ASTM standards) might be specified, number of retests, impact of weather on acceptable testing delays, and many other clauses can constrain the testing schedule more specifically than is implied by the standards directly.
7. Establishing Baseline Project Performance Standards
Before any field data is collected, you need a baseline that defines what “good performance” looks like for your project.
Performance Tables in the EPC Contract
Some EPCs include tables of expected monthly output, performance ratios, or AC capacity under various conditions. These serve as a contractual benchmark but are often derived from the same modeling tools used in ASTM E2939.
8. Preparation for Capacity Testing
Once your baseline is established, you’re ready to measure the real-world performance of the system using ASTM E2848.
Key Preparation Steps:
• Confirm that all monitoring equipment is calibrated and functioning.
• Ensure that POA sensors are co-planar with modules and free of soiling.
• Forecast a clear-sky window and plan accordingly.
• Time-synchronize all sensors and inverters to a common clock.
• Confirm that the system is operating normally—no outages, curtailments, or maintenance in progress.
9. Performing ASTM E2848: Measuring Real-World Capacity
ASTM E2848 uses real-time monitoring data to measure the actual capacity of a PV system, normalized to the conditions defined in the E2939 regression model.
Data Collection:
• Collect high-resolution data at the minimum available interval—typically 1-minute or 5-minute data—from the monitoring system.
• Required metrics:
• AC power output
• Plane-of-array irradiance
• Module and ambient temperatures
Data Filtering:
• Exclude intervals by irradiance as defined by the reporting conditions
• Remove data affected by clipping, shading, or rapid irradiance fluctuations.
• Ensure inverter uptime and system availability are consistent during the test window.
The Art (aka Professional Judgment) of Data Filtering
We promised art at the beginning of this post, and here’s where it really starts to matter.
2848 allows a great deal of flexibility in the way that you filter the data, which each require a deep understanding of the specific site conditions.
As an example, irradiance must be stable, and in range, but inverters can’t clip without throwing off the results. Threading this needle often involves digging into the details of inverter stringing, efficiency, and the PV syst model itself
Additional factors that might change the “correct” data exclusions might include terrain variation, the role of bifaciality, the precision of the met equipment on site (Secondary Standard vs. Second Class, etc.), and investigating any other “quirk” in that data that becomes apparent on review.
For instance, if a 25 MW site only has one or two irradiance sensors, the cutoff for “unstable irradiance” has to be set more broadly than if it has 4 or 5. Why? Because with a site of that size, a cloud can pass over part of the site but not the irradiance sensor. The data during this time will reflect pretty awful performance - but it’s ultimately just noise that should be excluded.
Having an excellent data collection and analysis system for reviewing and revising filtering setpoints is one of the most important elements of the process.
Within all of this complexity, it’s easy for bias and “p hacking” results to creep into process. Establishing clear standards that are agreed to ahead of time, clear reasoning behind any changes is important.
Given all of the above, utilizing a third party is typically the best way to ensure that all parties have confidence in the results.
Normalization and Analysis:
• Apply the E2939 regression model to normalize the monitored data.
• Calculate the normalized capacity—the actual performance the system delivers under expected reporting conditions.
• Compare this value against contractual expectations to assess compliance.
10. Common Pitfalls and Best Practices
Common Pitfalls:
• Misaligned POA sensors or dirty irradiance sensors
• Inverter clipping during test windows
• Unsynchronized timestamps between sensors and inverters
• Use of non-representative data (e.g., cloudy or unstable intervals)
Best Practices:
• Schedule testing only during stable, high-irradiance conditions BUT when inverters are not clipping.
• Verify system performance in advance with dry runs / monitoring data review.
• Use high-quality monitoring equipment with recent calibration. Low precision equipment introduces inherent ris.
• Document every aspect of the test—environmental conditions, uptime, and data filtering logic in a manner that it can be evaluated by third party engineering review.
11. Reporting and Documentation
ASTM-based capacity testing requires detailed reporting to satisfy technical reviewers, utility inspectors, and contract administrators.
Reports Should Include:
• A clear summary of the testing methodology and data filters
• Time-series plots of irradiance, temperature, and AC output
• Regression outputs from E2939
• Normalized capacity results from E2848
• Calibration certificates and data system specifications
• Explanation of any anomalies or exclusions
Ensure your report format matches any EPC contract specifications, finance requirements, or interconnection requirements.
12. Conclusion
We love to support our clients in setting up their own internal capacity testing system, and if you’re interested in support, please reach out. But the reality is that the capacity testing process is both challenging, and high stakes.
Liquidated damages from performance issues often exceed $100,000 - for larger projects that number might range into the millions. And not every team has the internal capacity to appropriately redline contract terms, fully incorporate the contract-specific terms into the technical capacity testing process, and conduct a fair and accurate assessment of whether the project is working as intended. We’ve spent almost a decade building out our systems, softwares and processes, to conduct accurate assessments.
If you’re interested in support with your next project, please reach out: